
Exploring the Latest Features in Google Colab: Data Tables, Dataframe Formatting, and Example.


Exploring the Latest Features in Google Colab: Data Tables, Dataframe Formatting, and Example.
On February 22, 2023, in our data analysis class, I explained the importance of Google colab, PANDAS function, and the basic of data preparation functions. See the Highlights below.
Google Colab Is a cloud-based development environment that allows users to write and execute Python code using a web browser. It provides free access to computing resources, including GPUs and TPUs, and allows users to collaborate with others in real time.
One of the key benefits of using Google Colab is that it eliminates the need for users to set up their own computing environment and can save time and resources when working on complex projects. It also provides a great way to share and collaborate on projects with others in a convenient and efficient way.
Google Colab is a popular tool for machine learning and data science, as it provides a range of pre-installed libraries and tools such as TensorFlow, Keras, and PyTorch. It also offers the ability to import and export data from various sources, including Google Drive and GitHub.
To get started with Google Colab, all you need is a Google account. Once you log in to Colab, you can create a new notebook, which is essentially a Python script that you can run on the Colab servers.
The notebook environment provides a range of features, including the ability to add comments, create headings, and insert code blocks. You can also add text, images, and videos to your notebook to provide context and documentation.
One of the key features of Google Colab is the ability to use GPU and TPU resources for accelerated computing. You can select your desired hardware from the "Runtime" menu, and Google Colab will provide the necessary resources to run your code.
Google Colab is a powerful tool for machine learning and data science, providing a cloud-based environment for writing and executing Python code, collaborating with others, and leveraging advanced computing resources. It's a great way to get started with machine learning and data science without the need for expensive hardware or complex software setups.
In the class, we identified the newly added feature which is “data_table formatter” in Google colab, let me explain with an example.
enable_dataframe_formatter() is a function provided by the google.colab.data_table module in Google Colab. This function allows you to enable the data_table formatter for all pandas dataframes that are displayed in the notebook.
So, to use enable_dataframe_formatter(), you first need to install the google.colab.data_table package, not often necessary on Google colab as it already pre-installed:
To install:
pip install google.colab.data_table
After installing the package, you can enable the data_table formatter for pandas dataframes by calling enable_dataframe_formatter(), see the sample code below:
from google.colab import data_table
data_table.enable_dataframe_formatter()
Once you have enabled the data_table formatter, all pandas dataframes that are displayed in the notebook will automatically use the data_table formatter. This means that you don't need to explicitly use DataTable(df) for each dataframe.
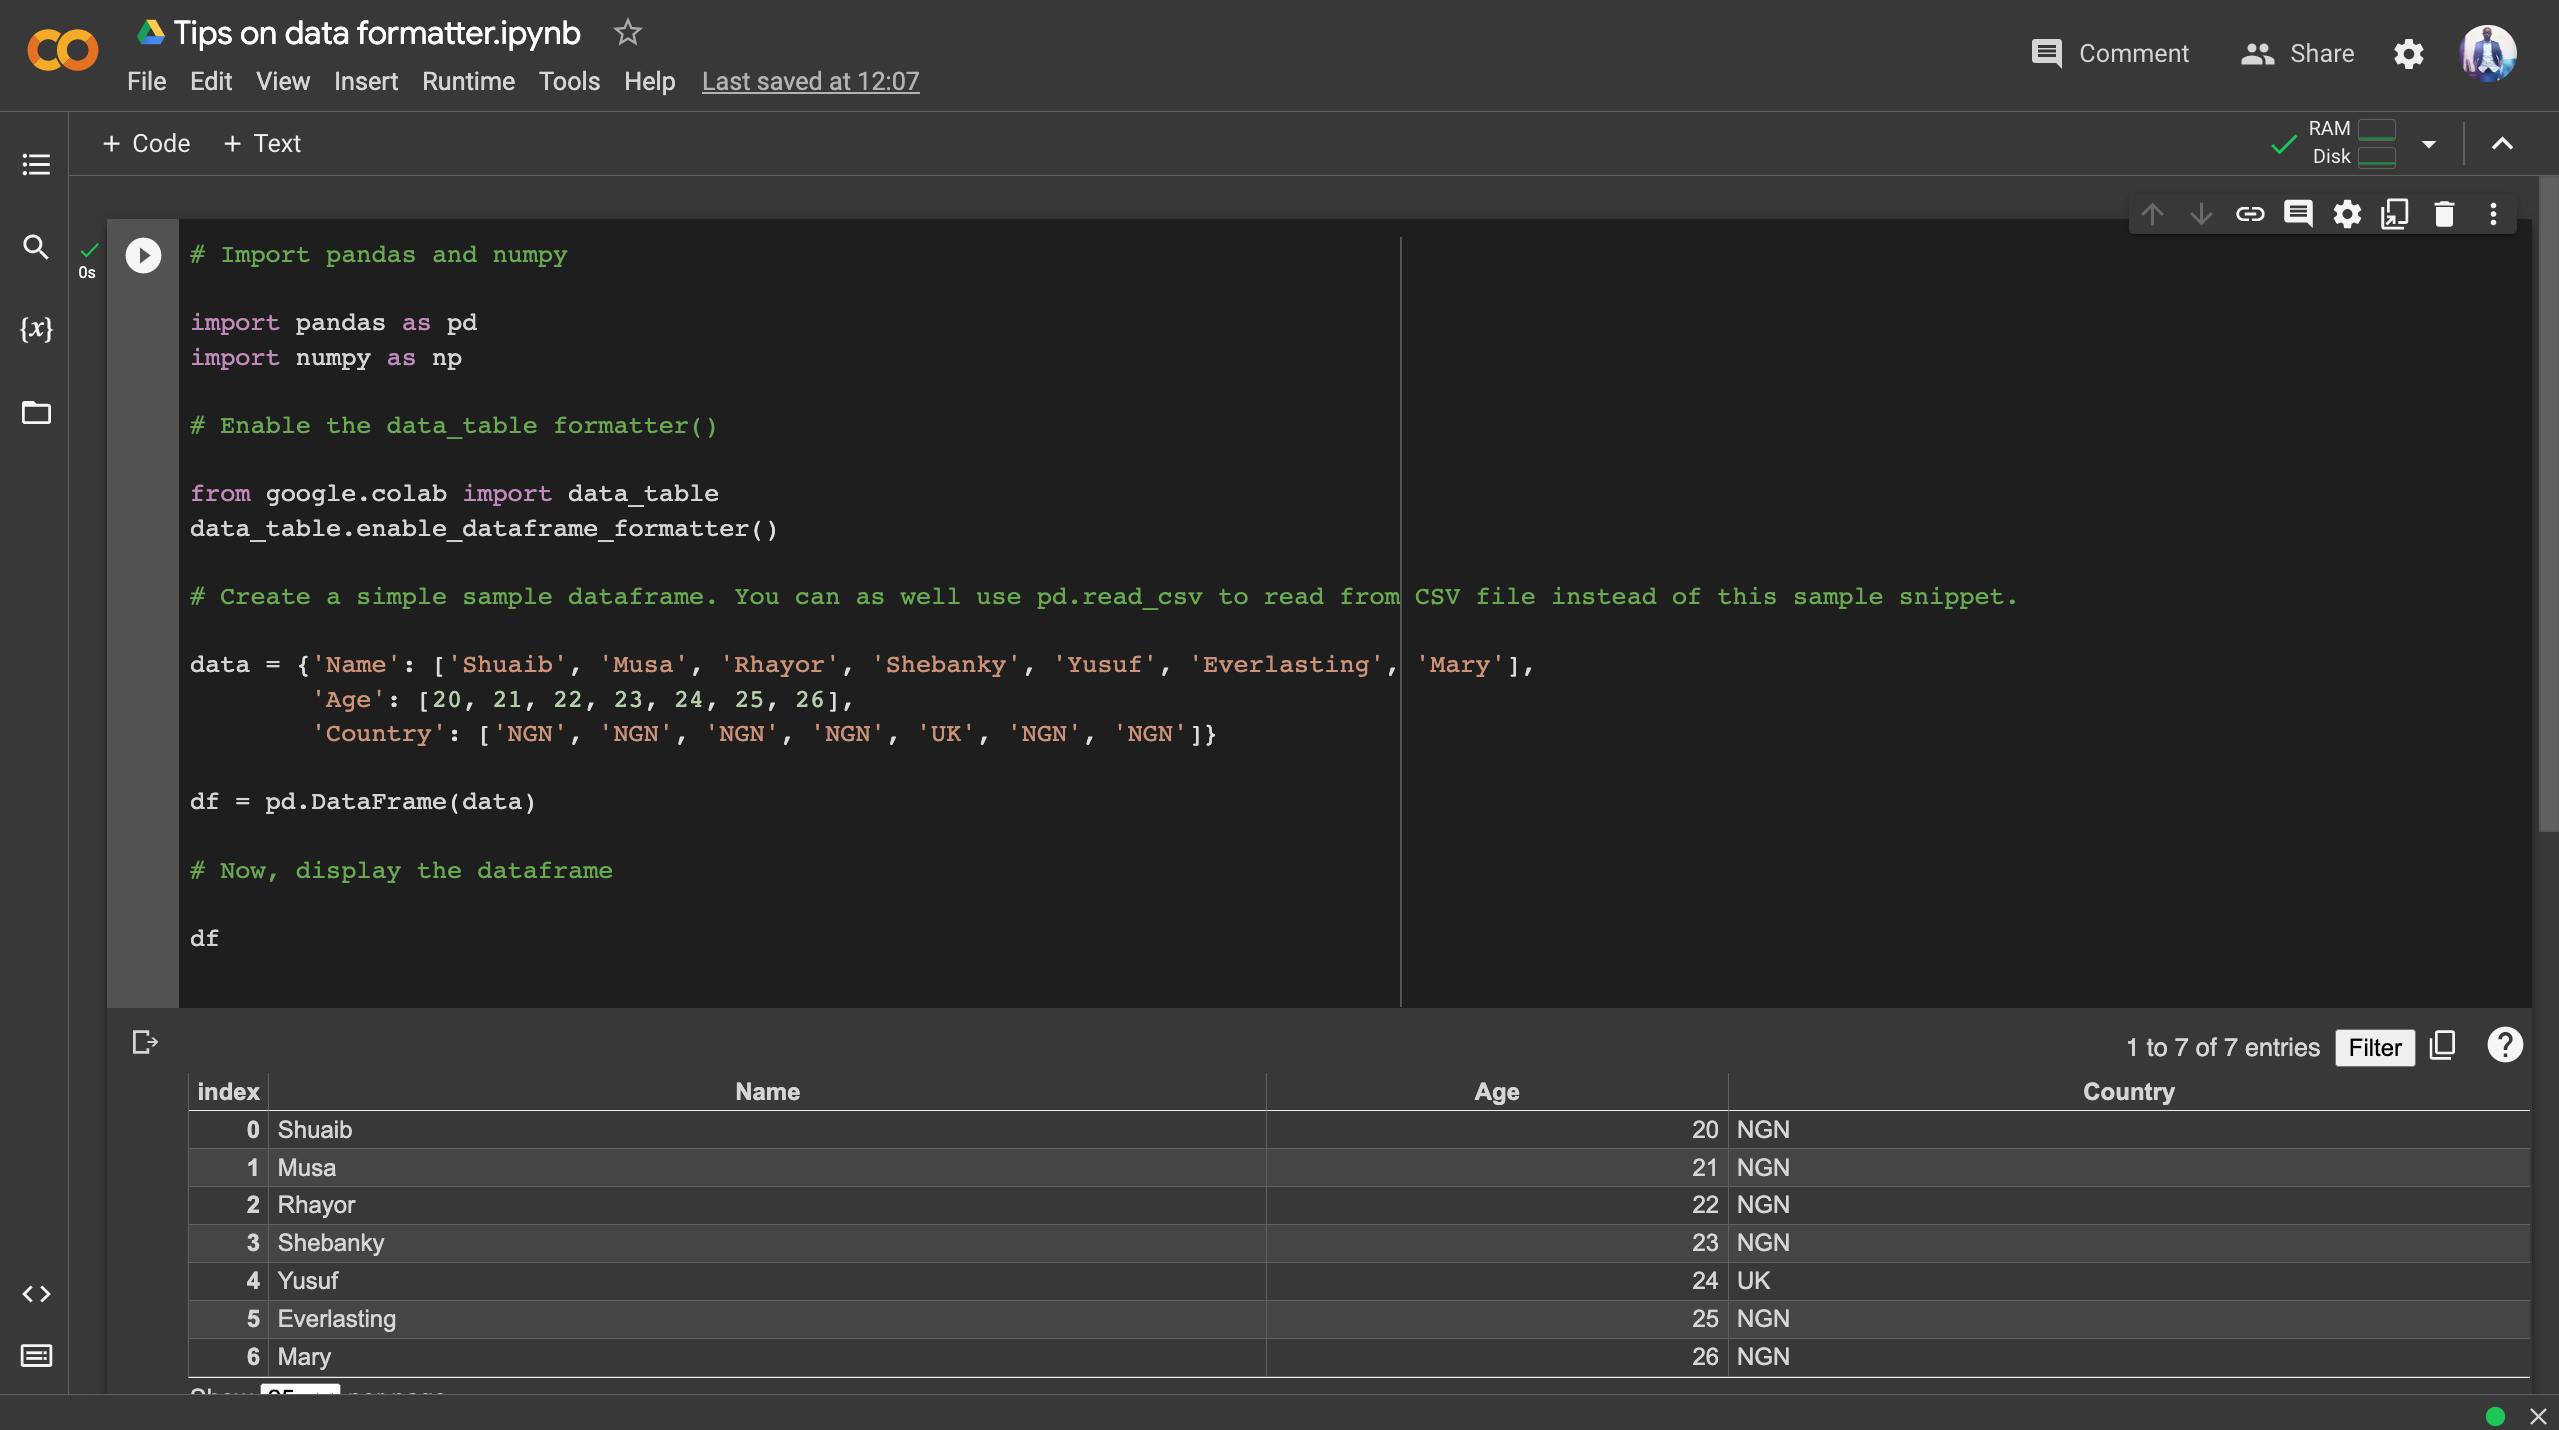
Here's an example of how to use enable_dataframe_formatter():
# Import pandas and numpy
import pandas as pd
import numpy as np
# Enable the data_table formatter()
from google.colab import data_table
data_table.enable_dataframe_formatter()
# Create a simple sample dataframe. You can as well use pd.read_csv to read from CSV file instead of this sample snippet.
data = {'Name': ['Shuaib', 'Musa', 'Rhayor', 'Shebanky', 'Yusuf', 'Everlasting', 'Mary'],
        'Age': [20, 21, 22, 23, 24, 25, 26],
        'Country': ['NGN', 'NGN', 'NGN', 'NGN', 'UK', 'NGN', 'NGN']

}
 df = pd.DataFrame(data)
# Now, display the dataframe
df
Result in Colab
This will display the dataframe in an interactive table format, which allows you to sort and filter the data, as well as adjust the column width.
Note that enable_dataframe_formatter() only needs to be called once per notebook, and the data_table formatter will be enabled for all subsequent pandas dataframes that are displayed in the notebook.
The link to the Google colab code:
https://colab.research.google.com/drive/14eIC1SYpECInpvCfI40GeUnY1dsToi7D?usp=sharing
In conclusion, Google Colab is a powerful tool that allows you to run Python code and perform data analysis tasks in the cloud. With its integration with Google Drive, GPU acceleration, and pre-installed libraries, it provides a convenient and efficient way to develop and share data analysis projects. Additionally, the data_table formatter provides an interactive table format for displaying dataframes in Google Colab, making it easier to explore and analyze large datasets. Whether you're a data scientist, software engineer, or student, Google Colab is a valuable resource for working with data in a collaborative and flexible environment.
I hope this helps.
Thank you